Case Studies#
In this section, we will explore real-world applications of linear regression in various fields, including healthcare, finance, and marketing. These case studies demonstrate the practical utility and versatility of linear regression in solving real-world problems.
Real-World Examples#
Healthcare#
Linear regression is widely used in healthcare for predicting patient outcomes, understanding disease progression, and optimizing treatment plans.
Predicting Patient Outcomes: Linear regression can be used to predict patient outcomes based on clinical measurements and patient history. For example, it can predict the risk of readmission for patients with chronic diseases based on factors such as age, weight, blood pressure, and treatment history.
Understanding Disease Progression: Linear regression can help understand how different factors contribute to the progression of diseases such as diabetes, heart disease, and cancer. For example, it can model the relationship between blood sugar levels, insulin dosage, and the progression of diabetes.
# Predicting Patient Outcomes

import pandas as pd
from sklearn.model_selection import train_test_split
from sklearn.linear_model import LinearRegression
from sklearn.metrics import mean_squared_error, r2_score

# Load a sample healthcare dataset
# For illustration, we create a synthetic dataset
data = pd.DataFrame(
    {
        "age": [25, 45, 35, 50, 23, 40, 60, 55, 30, 70],
        "weight": [70, 80, 75, 90, 68, 85, 95, 88, 78, 92],
        "blood_pressure": [120, 140, 130, 150, 115, 135, 145, 138, 125, 155],
        "treatment_history": [1, 3, 2, 4, 1, 3, 5, 4, 2, 5],
        "risk_of_readmission": [0.2, 0.5, 0.3, 0.6, 0.1, 0.4, 0.7, 0.6, 0.3, 0.8],
    }
)

X = data[["age", "weight", "blood_pressure", "treatment_history"]]
y = data["risk_of_readmission"]

# Split the data into training and testing sets
X_train, X_test, y_train, y_test = train_test_split(X, y, test_size=0.2, random_state=42)

# Create and train the model
model = LinearRegression()
model.fit(X_train, y_train)

# Make predictions
y_pred = model.predict(X_test)

# Evaluate the model
mse = mean_squared_error(y_test, y_pred)
r2 = r2_score(y_test, y_pred)

print(f"Mean Squared Error: {mse}")
print(f"R-squared: {r2}")
Mean Squared Error: 0.0015651761553099677
R-squared: 0.8434823844690033
Finance#
In finance, linear regression is used for risk management, portfolio optimization, and forecasting financial metrics.
Stock Price Prediction: Linear regression can be used to predict stock prices based on historical prices, trading volume, and economic indicators. For instance, it can model the relationship between a stock’s price and factors such as interest rates, GDP growth, and inflation.
Credit Scoring: Linear regression can be used to develop credit scoring models that assess the creditworthiness of individuals based on factors such as income, debt, and credit history. These models help financial institutions make informed lending decisions.
# Stock Price Prediction

import pandas as pd
from sklearn.model_selection import train_test_split
from sklearn.linear_model import LinearRegression
from sklearn.metrics import mean_squared_error, r2_score

# Load a sample finance dataset
# For illustration, we create a synthetic dataset
data = pd.DataFrame(
    {
        "historical_price": [150, 155, 160, 158, 162, 165, 168, 170, 172, 175],
        "trading_volume": [2000, 2200, 2100, 2050, 2150, 2300, 2400, 2350, 2500, 2550],
        "interest_rate": [0.02, 0.025, 0.022, 0.023, 0.021, 0.024, 0.025, 0.026, 0.027, 0.028],
        "gdp_growth": [2.5, 2.7, 2.6, 2.8, 2.5, 2.7, 2.8, 2.9, 3.0, 3.1],
        "stock_price": [155, 160, 162, 161, 164, 167, 170, 172, 174, 177],
    }
)

X = data[["historical_price", "trading_volume", "interest_rate", "gdp_growth"]]
y = data["stock_price"]

# Split the data into training and testing sets
X_train, X_test, y_train, y_test = train_test_split(X, y, test_size=0.2, random_state=42)

# Create and train the model
model = LinearRegression()
model.fit(X_train, y_train)

# Make predictions
y_pred = model.predict(X_test)

# Evaluate the model
mse = mean_squared_error(y_test, y_pred)
r2 = r2_score(y_test, y_pred)

print(f"Mean Squared Error: {mse}")
print(f"R-squared: {r2}")
Mean Squared Error: 0.5366723915998722
R-squared: 0.9890475022122475
Marketing#
In marketing, linear regression is used to analyze consumer behavior, optimize marketing campaigns, and forecast sales.
Customer Lifetime Value (CLV) Prediction: Linear regression can predict the customer lifetime value based on factors such as purchase history, frequency of purchases, and customer demographics. This helps businesses identify high-value customers and tailor marketing strategies accordingly.
Sales Forecasting: Linear regression can forecast future sales based on historical sales data, advertising spend, and seasonal trends. This helps businesses plan inventory, manage resources, and optimize marketing efforts.
# Customer Lifetime Value (CLV) Prediction

import pandas as pd
from sklearn.model_selection import train_test_split
from sklearn.linear_model import LinearRegression
from sklearn.metrics import mean_squared_error, r2_score

# Load a sample marketing dataset
# For illustration, we create a synthetic dataset
data = pd.DataFrame(
    {
        "purchase_history": [200, 250, 300, 150, 100, 350, 400, 450, 500, 550],
        "frequency_of_purchases": [5, 6, 7, 3, 2, 8, 9, 10, 11, 12],
        "customer_age": [25, 30, 35, 22, 20, 40, 45, 50, 55, 60],
        "customer_income": [50000, 60000, 70000, 40000, 30000, 80000, 90000, 100000, 110000, 120000],
        "clv": [1000, 1200, 1400, 800, 600, 1600, 1800, 2000, 2200, 2400],
    }
)

X = data[["purchase_history", "frequency_of_purchases", "customer_age", "customer_income"]]
y = data["clv"]

# Split the data into training and testing sets
X_train, X_test, y_train, y_test = train_test_split(X, y, test_size=0.2, random_state=42)

# Create and train the model
model = LinearRegression()
model.fit(X_train, y_train)

# Make predictions
y_pred = model.predict(X_test)

# Evaluate the model
mse = mean_squared_error(y_test, y_pred)
r2 = r2_score(y_test, y_pred)

print(f"Mean Squared Error: {mse}")
print(f"R-squared: {r2}")
Mean Squared Error: 2.5849394142282115e-26
R-squared: 1.0
# Sales Forecasting
import pandas as pd
from sklearn.model_selection import train_test_split
from sklearn.linear_model import LinearRegression
from sklearn.metrics import mean_squared_error, r2_score
import matplotlib.pyplot as plt
# Load the sales dataset
data = pd.read_csv("sales_data.csv")
X = data[["advertising", "economic_index", "seasonality"]].values
y = data["sales"].values
# Split the data into training and testing sets
X_train, X_test, y_train, y_test = train_test_split(X, y, test_size=0.2, random_state=42)
# Create and train the model
model = LinearRegression()
model.fit(X_train, y_train)
# Make predictions
y_pred = model.predict(X_test)
# Evaluate the model
mse = mean_squared_error(y_test, y_pred)
r2 = r2_score(y_test, y_pred)
print(f"Mean Squared Error: {mse}")
print(f"R-squared: {r2}")
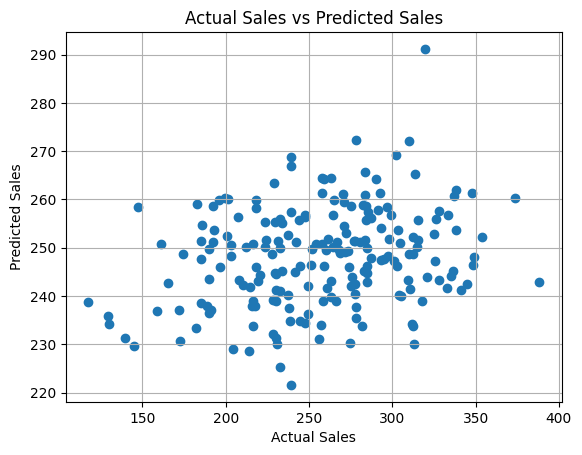
# Visualize the results
# Plot predictions vs actual values
plt.scatter(y_test, y_pred)
plt.xlabel("Actual Sales")
plt.ylabel("Predicted Sales")
plt.title("Actual Sales vs Predicted Sales")
plt.grid()
plt.show()
Mean Squared Error: 2544.752122146915
R-squared: 0.03287894342532782
Summary#
These case studies highlight the versatility and practical utility of linear regression in various fields. In healthcare, it can predict patient outcomes and understand disease progression. In finance, it can forecast stock prices and assess credit risk. In marketing, it can predict customer lifetime value and forecast sales. By applying linear regression to real-world problems, businesses and organizations can make data-driven decisions and optimize their operations.