Inferential Statistics#
Inferential statistics allow us to make inferences and draw conclusions about a population based on sample data. They provide methods for estimating population parameters, testing hypotheses, and making predictions. Inferential statistics are essential for understanding the relationships between variables and for generalizing findings from a sample to a larger population.
Key Concepts#
Hypothesis Testing#
Hypothesis testing is a method for making decisions about a population based on sample data. It involves formulating a null hypothesis (\(H_0\)) and an alternative hypothesis (\(H_a\)), then using statistical tests to determine whether there is enough evidence to reject the null hypothesis.
Null Hypothesis (\(H_0\)): The hypothesis that there is no effect or no difference.
Alternative Hypothesis (\(H_a\)): The hypothesis that there is an effect or a difference.
Test Statistic: A value calculated from the sample data that is used to determine whether to reject \(H_0\).
P-Value: The probability of obtaining a test statistic at least as extreme as the one observed, assuming \(H_0\) is true.
Significance Level (\(\alpha\)): A threshold for the p-value below which \(H_0\) is rejected (commonly 0.05).
Confidence Intervals#
A confidence interval is a range of values used to estimate the true value of a population parameter. It provides a measure of the uncertainty associated with the estimate.
Point Estimate: A single value used to estimate a population parameter (e.g., sample mean).
Interval Estimate: A range of values, derived from the sample data, within which the population parameter is expected to lie with a certain level of confidence (e.g., 95% confidence interval).
The formula for a confidence interval for the mean (assuming a normal distribution) is:
where \(\bar{x}\) is the sample mean, \(z\) is the z-score corresponding to the desired confidence level, \(\sigma\) is the population standard deviation, and \(n\) is the sample size.
Regression Analysis#
Regression analysis is a statistical method for modeling the relationship between a dependent variable and one or more independent variables. It is widely used for prediction and forecasting.
Simple Linear Regression: Models the relationship between a single independent variable and a dependent variable.
Multiple Linear Regression: Models the relationship between multiple independent variables and a dependent variable.
The formula for simple linear regression is:
where \(y\) is the dependent variable, \(x\) is the independent variable, \(\beta_0\) is the intercept, \(\beta_1\) is the slope, and \(\epsilon\) is the error term.
Examples of Inferential Statistics in Python#
Example 1: Hypothesis Testing#
import numpy as np
from scipy import stats

# Sample data
data = np.array([10, 12, 14, 15, 18, 20, 22, 24, 25, 30])

# One-sample t-test
t_statistic, p_value = stats.ttest_1samp(data, popmean=20)
print(f"T-Statistic: {t_statistic}")
print(f"P-Value: {p_value}")

# Interpret the result
alpha = 0.05
if p_value < alpha:
    print("Reject the null hypothesis (H0)")
else:
    print("Fail to reject the null hypothesis (H0)")
T-Statistic: -0.49724515809884695
P-Value: 0.6309369241258991
Fail to reject the null hypothesis (H0)
Example 2: Confidence Intervals#
import numpy as np
from scipy import stats

# Sample data
data = np.array([10, 12, 14, 15, 18, 20, 22, 24, 25, 30])

# Calculate the sample mean and standard error
mean = np.mean(data)
sem = stats.sem(data)

# 95% confidence interval
confidence = 0.95
h = sem * stats.t.ppf((1 + confidence) / 2.0, len(data) - 1)
confidence_interval = (mean - h, mean + h)
print(f"95% Confidence Interval: {confidence_interval}")
95% Confidence Interval: (14.450620029155907, 23.549379970844093)
Example 3: Regression Analysis#
import numpy as np
import matplotlib.pyplot as plt
from sklearn.linear_model import LinearRegression

# Sample data
X = np.array([1, 2, 3, 4, 5]).reshape(-1, 1)
y = np.array([2, 3, 5, 7, 11])

# Fit the model
model = LinearRegression()
model.fit(X, y)

# Predict
y_pred = model.predict(X)

# Plot the results
plt.scatter(X, y, color="blue")
plt.plot(X, y_pred, color="red")
plt.xlabel("X")
plt.ylabel("y")
plt.title("Simple Linear Regression")
plt.grid()
plt.show()

# Print the coefficients
print(f"Intercept: {model.intercept_}")
print(f"Slope: {model.coef_[0]}")
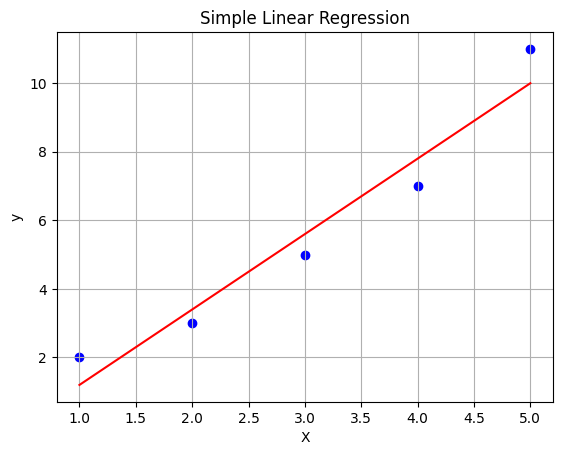
Intercept: -1.0000000000000018
Slope: 2.2000000000000006
Summary#
Inferential statistics provide methods for making inferences about populations based on sample data. They are essential for hypothesis testing, estimating population parameters, and modeling relationships between variables. By mastering inferential statistics, you can make informed decisions and predictions based on data.
In the next section, we will explore more advanced statistical techniques and their applications in machine learning.