Evaluating the Model#
Performance Metrics#
Evaluating the performance of a linear regression model is crucial to understand how well it predicts the dependent variable. Various metrics can be used to assess the model’s accuracy and goodness of fit.
R-squared#
R-squared, also known as the coefficient of determination, measures the proportion of the variance in the dependent variable that is predictable from the independent variable(s). It is given by:
where:
\(SS_{\text{res}}\) is the sum of squares of the residuals,
\(SS_{\text{tot}}\) is the total sum of squares (variance of the dependent variable).
R-squared ranges from 0 to 1, where 0 indicates that the model does not explain any of the variance and 1 indicates that the model explains all the variance. Higher values of R-squared indicate a better fit.
Adjusted R-squared#
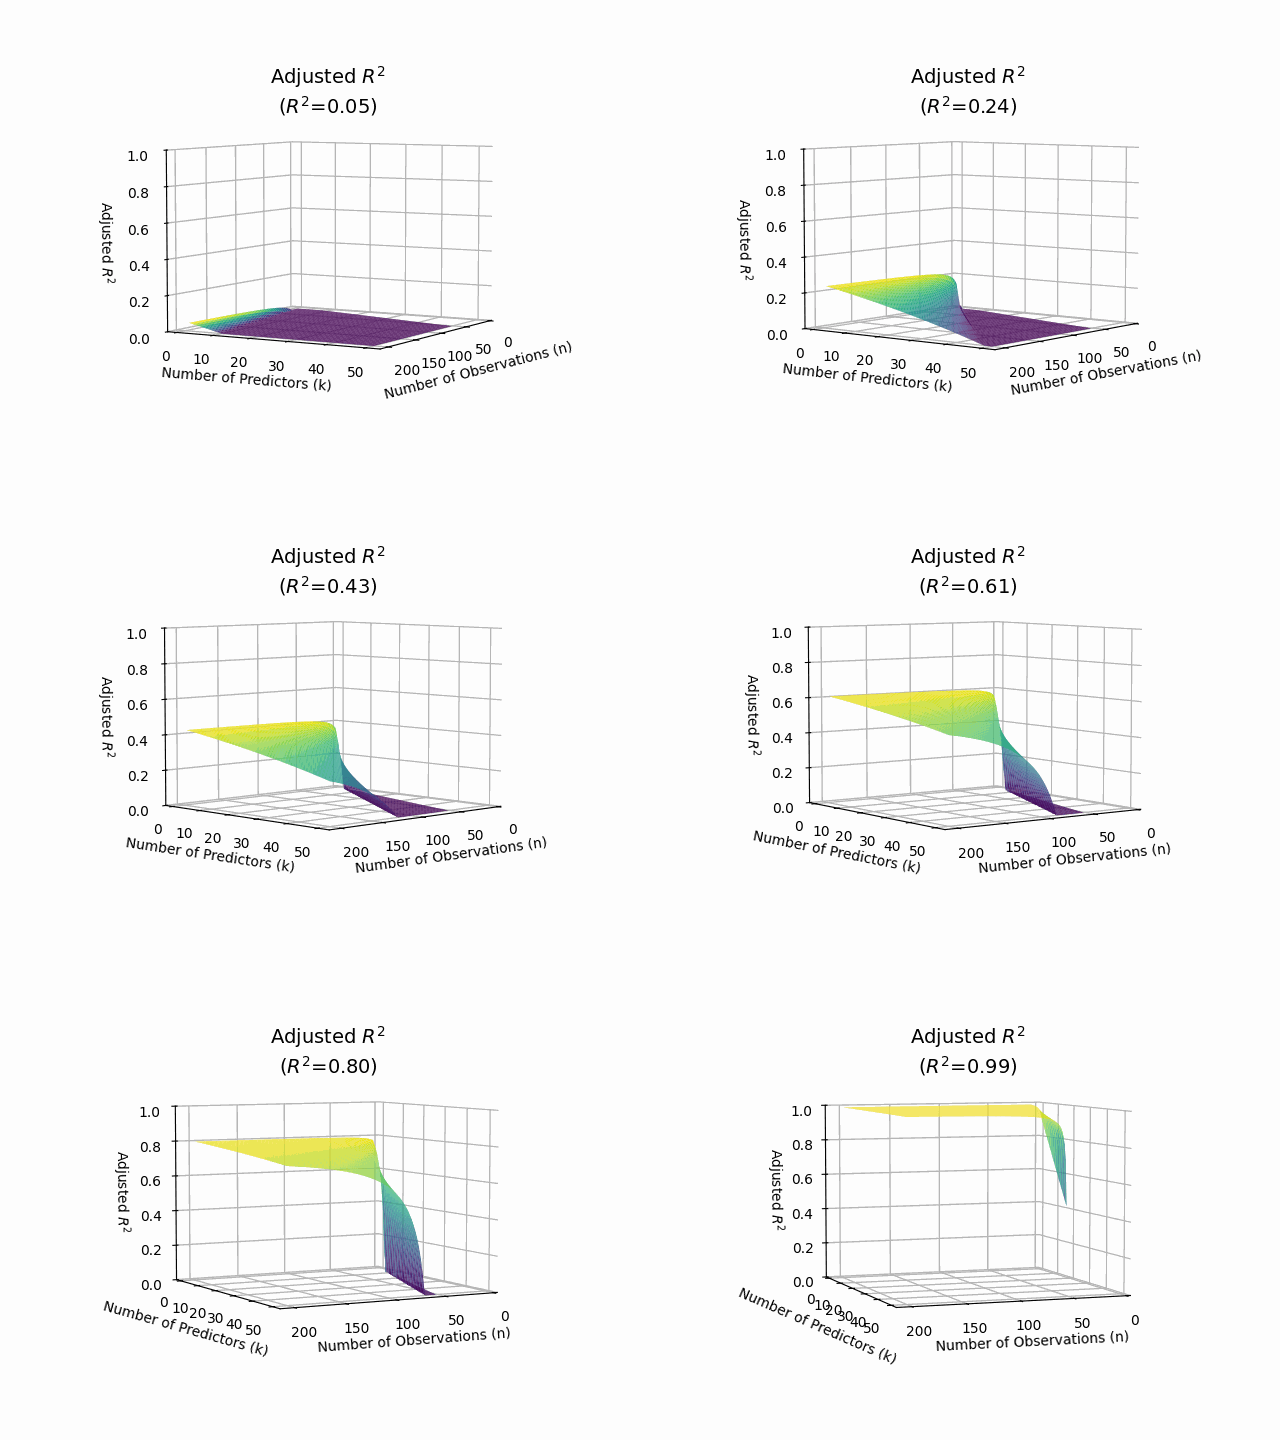
Adjusted R-squared adjusts the R-squared value based on the number of predictors in the model. It accounts for the potential overfitting that can occur with the addition of more variables. The formula for adjusted R-squared is:
where:
\(n\) is the number of observations,
\(k\) is the number of predictors.
Adjusted R-squared can be lower than R-squared and provides a more accurate measure of model fit when multiple predictors are involved.

Mean Squared Error (MSE)#
Mean Squared Error (MSE) is the average of the squared differences between the predicted values (\(\hat{y}\)) and the actual values (\(y\)):
MSE is widely used to measure the quality of a linear regression model, with lower values indicating better performance.
Root Mean Squared Error (RMSE)#
Root Mean Squared Error (RMSE) is the square root of the Mean Squared Error. It provides a measure of the average magnitude of the errors in the same units as the dependent variable:
RMSE is more interpretable than MSE because it is in the same unit as the dependent variable, making it easier to understand the model’s prediction errors.
Cross-Validation#
Cross-validation is a technique used to assess the generalizability of the model by evaluating its performance on different subsets of the data. It helps in understanding how the model performs on unseen data and reduces the risk of overfitting.
K-Fold Cross-Validation#
K-Fold Cross-Validation involves dividing the dataset into \(k\) equal-sized folds. The model is trained on \(k-1\) folds and tested on the remaining fold. This process is repeated \(k\) times, with each fold used exactly once as the test set. The performance metrics are averaged over the \(k\) iterations to provide an overall evaluation:
Split the dataset into \(k\) folds.
For each fold:
Train the model on \(k-1\) folds.
Test the model on the remaining fold.
Calculate the average performance metrics.
Common values for \(k\) are 5 and 10. K-Fold Cross-Validation provides a robust estimate of model performance and helps in selecting the best model.
Leave-One-Out Cross-Validation#
Leave-One-Out Cross-Validation (LOOCV) is a special case of K-Fold Cross-Validation where \(k\) is equal to the number of data points (\(n\)). In LOOCV, the model is trained on \(n-1\) data points and tested on the remaining single data point. This process is repeated \(n\) times, with each data point used exactly once as the test set:
For each data point:
Train the model on \(n-1\) data points.
Test the model on the remaining data point.
Calculate the average performance metrics.
LOOCV provides an unbiased estimate of model performance but can be computationally expensive for large datasets. It is particularly useful when the dataset is small and every data point is valuable.
Summary#
Evaluating the model using performance metrics and cross-validation techniques ensures that the linear regression model is accurate, generalizable, and reliable. Understanding these evaluation methods helps in making informed decisions about model improvements and selection.
